Basic vs Enhanced Health Checks on AWS ELB
Posted on Thu 29 June 2017 in Articles
The Problem
Yesterday I started getting a lot of emails from Amazon saying that there were issues with the ELB application that runs my Alexa App.
Something fishy with #ELB on @awscloud over the last 24 hours... (no changes to application and load is stable and low) pic.twitter.com/1wo2GupypW
— Timothy Van Heest (@turtlemonvh) June 28, 2017
Investigation
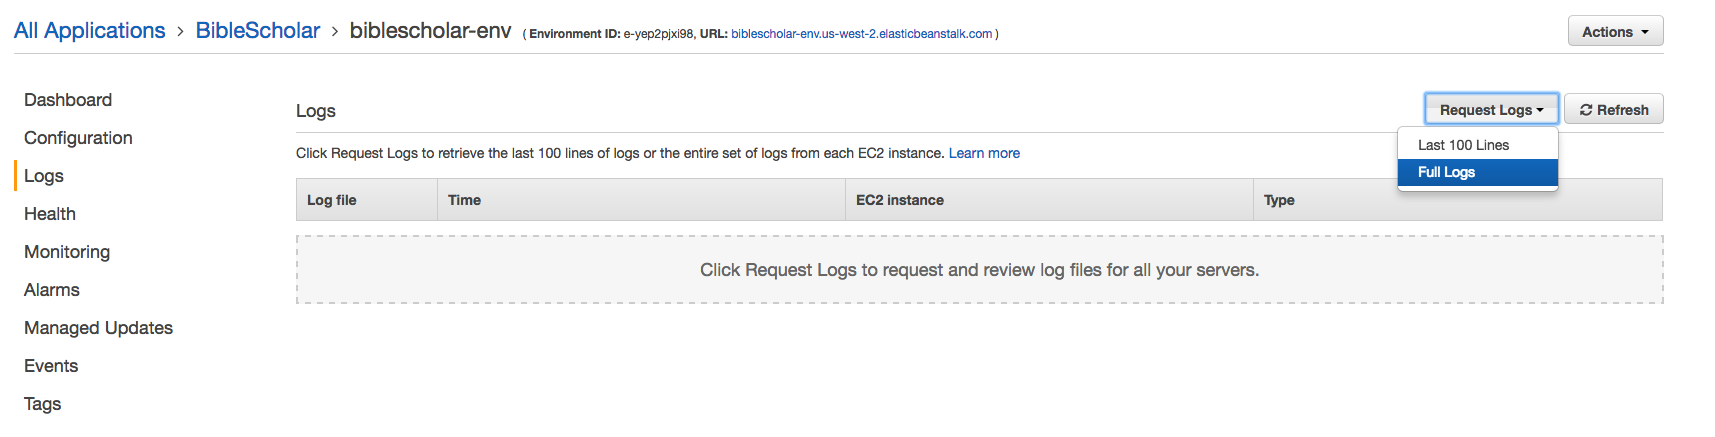
I dug into this a bit more this morning. Assuming you deploy your ELB application in a pretty standard configuration AWS allows you to download application logs. This is what it looks like on the ELB download page.
Because I wanted to check the logs over the course of a few days, I opted for "Full Logs". What you get from this is a zip file of logs. When you extract the contents, it will look something like this:
1 2 3 4 5 6 7 8 9 10 11 12 13 14 15 16 17 18 19 20 21 22 23 24 25 26 27 28 29 30 31 32 33 34 35 36 37 38 39 40 41 42 43 44 45 46 47 48 49 50 51 52 53 54 55 56 57 58 59 60 | |
Because ELB was saying that my application was sick because of a lot of 4XX return codes, the first thing I checked was the access logs. Here's what that looked like on the command line.
1 2 3 4 5 6 7 8 9 10 11 12 13 14 15 16 | |
Here is a sample of some log lines that were resulting in 404s.
172.31.22.184 - - [26/Jun/2017:05:19:35 +0000] "GET /a2billing/customer/templates/default/footer.tpl HTTP/1.1" 404 18 "-" "python-requests/2.6.0 CPython/2.6.6 Linux/2.6.32-696.3.1.el6.x86_64"
172.31.31.21 - - [26/Jun/2017:05:59:03 +0000] "GET /mysqladmin/scripts/setup.php HTTP/1.1" 404 18 "-" "the beast"
172.31.31.21 - - [26/Jun/2017:06:59:20 +0000] "GET /manager/html HTTP/1.1" 404 18 "-" "Mozilla/5.0 (compatible; MSIE 10.0; Windows NT 6.2; WOW64; Trident/6.0)"
172.31.22.184 - - [26/Jun/2017:09:22:36 +0000] "HEAD / HTTP/1.1" 404 0 "-" "python-requests/2.8.1"
172.31.31.21 - - [26/Jun/2017:13:00:20 +0000] "GET /manager/html HTTP/1.1" 404 18 "-" "Mozilla/5.0 (compatible; MSIE 10.0; Windows NT 6.2; WOW64; Trident/6.0)"
172.31.22.184 - - [26/Jun/2017:15:29:04 +0000] "GET /blog/the-7-funniest-k-pop-covers-from-mnets-i-can-see-your-voice/2311 HTTP/1.1" 404 18 "http://m.facebook.com/" "Mozilla/5.0 (Linux; Android 6.0.1; HTC Desire 826 dual sim Build/MMB29M; wv) AppleWebKit/537.36 (KHTML, like Gecko) Version/4.0 Chrome/58.0.3029.83 Mobile Safari/537.36 [FB_IAB/FB4A;FBAV/129.0.0.29.67;]"
172.31.22.184 - - [26/Jun/2017:16:02:02 +0000] "GET /blog/the-7-funniest-k-pop-covers-from-mnets-i-can-see-your-voice/2311 HTTP/1.1" 404 18 "http://m.facebook.com/" "Mozilla/5.0 (Linux; Android 5.1; A1601 Build/LMY47I; wv) AppleWebKit/537.36 (KHTML, like Gecko) Version/4.0 Chrome/58.0.3029.83 Mobile Safari/537.36 [FB_IAB/FB4A;FBAV/129.0.0.29.67;]"
172.31.22.184 - - [26/Jun/2017:21:00:49 +0000] "GET /testproxy.php HTTP/1.1" 404 18 "-" "Mozilla/5.0 (Windows NT 5.1; rv:32.0) Gecko/20100101 Firefox/31.0"
172.31.31.21 - - [26/Jun/2017:22:20:04 +0000] "GET /testproxy.php HTTP/1.1" 404 18 "-" "Mozilla/5.0 (Windows NT 5.1; rv:32.0) Gecko/20100101 Firefox/31.0"
172.31.22.184 - - [26/Jun/2017:22:26:12 +0000] "GET /blog/the-7-funniest-k-pop-covers-from-mnets-i-can-see-your-voice/2311 HTTP/1.1" 404 18 "http://m.facebook.com/" "Mozilla/5.0 (Linux; Android 6.0.1; SM-G935F Build/MMB29K; wv) AppleWebKit/537.36 (KHTML, like Gecko) Version/4.0 Chrome/58.0.3029.83 Mobile Safari/537.36 [FB_IAB/FB4A;FBAV/129.0.0.29.67;]"
172.31.31.21 - - [26/Jun/2017:22:53:06 +0000] "GET /muieblackcat HTTP/1.1" 404 18 "-" "-"
172.31.31.21 - - [26/Jun/2017:22:53:06 +0000] "GET /phpMyAdmin/scripts/setup.php HTTP/1.1" 404 18 "-" "-"
172.31.31.21 - - [26/Jun/2017:22:53:06 +0000] "GET /phpmyadmin/scripts/setup.php HTTP/1.1" 404 18 "-" "-"
172.31.31.21 - - [26/Jun/2017:22:53:06 +0000] "GET /pma/scripts/setup.php HTTP/1.1" 404 18 "-" "-"
If you've run a public facing internet application before (or even an internal application at a company that does regular vulnerability scans) you will recognize this type of output. These are automated tools probing the website for common vulnerabilities. Those blog requests are likely to be due to an old site that was hosted at the same public ip as my application. So the application is doing exactly what it is supposed to be doing when it returns a 404 for these requests. The problem is that ELB is categorizing any 4XX response as a possible failure in the application.
This is burried a little bit in the documentation, but if you check out the docs on enhanced health checks that section does state the following about how it uses HTTP requests to determine health.
When no operation is in progress on an environment, the primary source of information about instance and environment health is the web server logs for each instance. To determine the health of an instance and the overall health of the environment, Elastic Beanstalk considers the number of requests, the result of each request, and the speed at which each request was resolved.
Solution
To fix this, I went to the "Configuration > Health" page on the ELB dashboard and changed the section on "Health Reporting" to use "Basic" health checks instead of "Enhanced". This triggered a restart of the ELB application.
Once that restart finished, I ran this simple curl script for a few minutes to send a bunch of requests to the application that would trigger 404s.
1 2 3 4 5 | |
Then I checked the ELB dashboard to confirm that even with all these requests coming in, the application health was still reporting as 'OK'. Everything looked fine.
With that updated, hopefully I'll be getting less monitoring emails!
Summary
The enhanced health feature of ELB is pretty neat. It provides a lot of nice metrics, and can detect some pretty common failure conditions.
However, it is very fragile since it considers a large number of 4XX errors to be an indicator of problems in the application. Since 4XX errors are supposed to indicate client errors (not server errors), this is not a great default configuration. Ideally, the application would be considered unhealthy when lots of 5XX errors are returned, but still healthy when 4XX errors are returned.
In addition to just be annoying, this means that every ELB application out there that uses "Enhanced Health Checks" may be prone to a trivial availability attack. All you need to do is send a large number of requests to urls the application doesn't understand (i.e. that return 404s), and ELB will start marking app instances as unhealthy and quickly trying to cycle the pool of application instances to get into a healthy state. I think that ELB will still keep a minimum number of application instances available while it does this (so the site won't go down), but it could get expensive and kind of annoying.
So even though "Enhanced Health Checks" are cool, I don't think I'm ever going to use them again. It's simpler and safer to set up a custom health check endpoint that accurately reflects the health o your application.
UPDDATE (10 am EST 2017/06/29)
Unsurprisingly, it looks like I'm not the first one to run into this.
- https://forums.aws.amazon.com/thread.jspa?messageID=695637
- Forum post pointing out the problem with marking app as sick when you get lots of 4XX responses
- One user points out that lots of 4XX can at the very least block a deployment from succeeding
- https://stackoverflow.com/questions/36398456/elastic-beanstalk-disable-health-state-change-based-on-4xx-responses
- stackoverflow post asking for information about the configurability of "Enhanced Health Checks"
- contains an "interesting" hack to rewrite a monitoring script used by AWS to monitor the logs and determine health state
Also, the comments on the blog don't seem to be working right now and I don't have time to fix that right now, so until those are back, I recommend commenting on one of those posts or reaching out to me on twitter by responding to the following tweet.
This behavior was surprising enough that I took time to write about it:https://t.co/bvKkf3kOaK
— Timothy Van Heest (@turtlemonvh) June 29, 2017
tldr: beware #ELB "enhanced health checks"